Using the Synoptic Maps and the Sydney weather report below answer the following questions: (more questions under the synoptic charts). Copy the images from this page and put them in your blog.
- What is it about the pressure system stalled over Australia that relates to the weather over the next 4 days?
There is a high pressure which will mean warm sunny weather over the next four days with minimal cloud cover. - What is the air pressure in each of the next 4 days for each of the capital cities? How does this correspond with the predicted weather for these cities?
Thursday
Brisbane - 1017 hpa
Sydney - 1022 hpa
Melbourne - 1026 hpa
Canberra - 1024 hpa
Hobart - 1023 hpa
Darwin - 1012 hpa
Perth - 1012 hpa
Adelaide - 1025 hpa
Friday
Brisbane - 1015 hpa
Sydney - 1012 hpa
Melbourne - 1024 hpa
Canberra - 1020 hpa
Hobart - 1020 hpa
Darwin - 1012 hpa
Perth - 1020 hpa
Adelaide - 1024 hpa
Saturday
Brisbane - 1017 hpa
Sydney - 1013 hpa
Melbourne - 1018 hpa
Canberra - 1020 hpa
Hobart - 1016 hpa
Darwin - 1012 hpa
Perth - 1020 hpa
Adelaide - 1020 hpa
Sunday
Brisbane - 1016 hpa
Sydney - 1018 hpa
Melbourne - 1024 hpa
Canberra - 1020 hpa
Hobart - 1024 hpa
Darwin - 1012 hpa
Perth - 1016 hpa
Adelaide - 1024 hpa


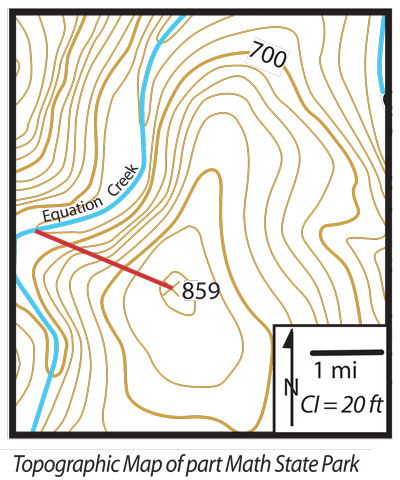
What is the contour interval (sometimes abbreviated CI)? Convert to metric.
20 feet (6m)
What is the scale of the map? Convert it into the metric system.
1cm = 1 mile or 1cm = 1.6 km
What is the gradient of the line? Calculate in metric system.
859-680 = 121 (36m)
2cm line = 2 miles (3218m)
gradient = 3218/36
= 89
No comments:
Post a Comment